Time Series Plot
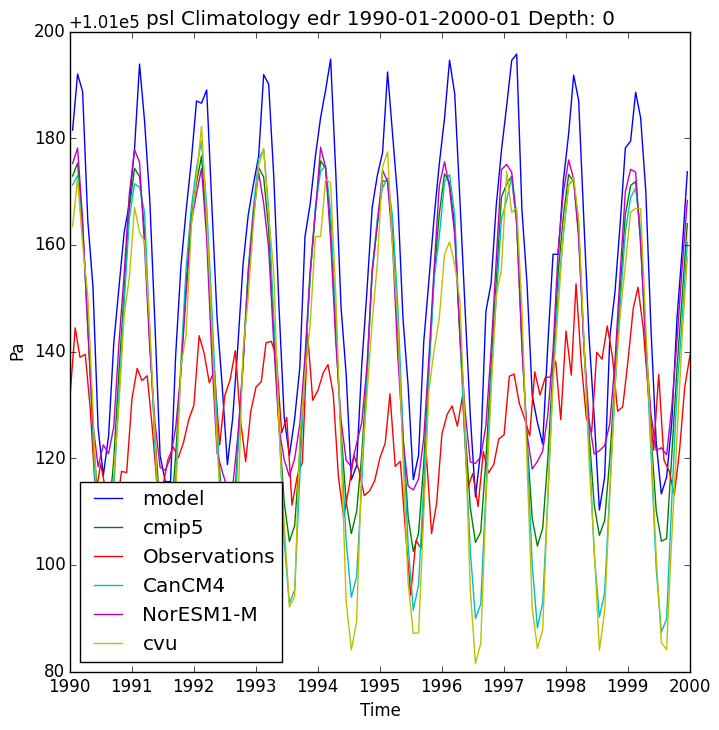
For this example we want to make a time series plot of the atmospheric pressure at the surface for the climatology from 1980 to 2000.
First use the command:
validate-configure
Then edit the conf.yaml file to the following:
run: 'edr'
experiment: 'historical'

defaults:
            dates:
              start_date: '1990-01'
              end_date: '2000-01'
            png: True

plots:
        - variable: 'psl'
          plot_projection: 'time_series'
          comp_obs:
            - 20CR
          comp_cmips: 'all'
          comp_ids:
            - cvu

delete:
          del_netcdf: False
          del_mask: True
          del_ncstore: True
          del_cmipfiles: False

direct_data_root: '/raid/rc40/data/ncs/historical-edr/'
observations_root: '/raid/rc40/data/ncs/obs4comp'
cmip5_root: '/raid/ra40/CMIP5_OTHER_DOWNLOADS/'
Save the file and then use the command:
validate-configure